

Project OverProject Overview
In this project, Datraxa explored the Netflix dataset from Kaggle, which includes more than 8,000 titles.
Our goal was to find patterns in movies and TV shows — such as release years, genres, countries, and ratings.
We used Python, Pandas, and visualization tools like Matplotlib, Seaborn, and Plotly to study the Netflix data analysis and create clear visuals that show how Netflix’s content has changed over time.
🔍 Key Highlights
- Cleaned and prepared the data:
Fixed missing release dates, unified genre names, and corrected year errors. - Visualized content growth:
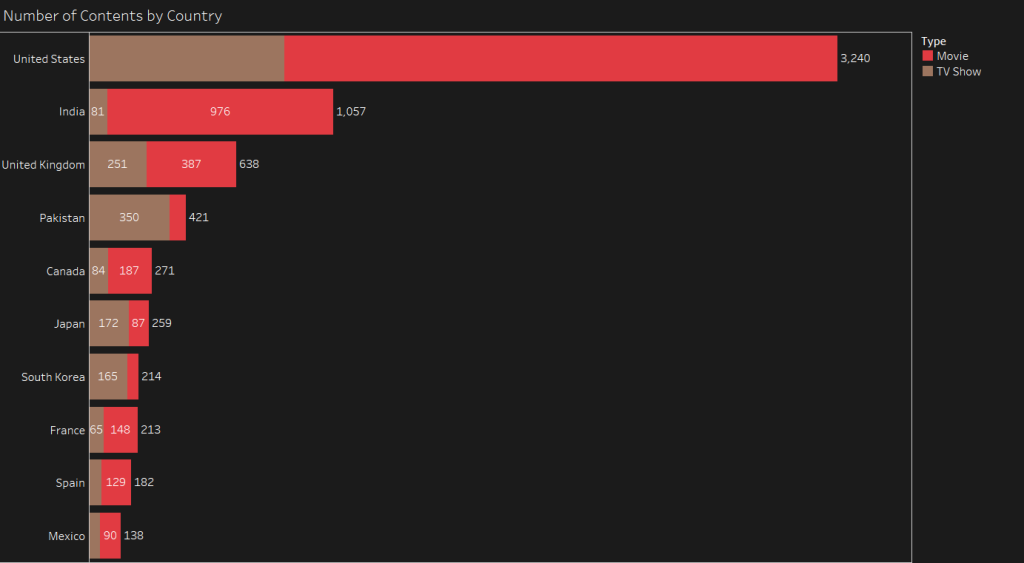
Compared the rise of TV shows vs. movies and showed how genres spread across different countries. - Found new insights:
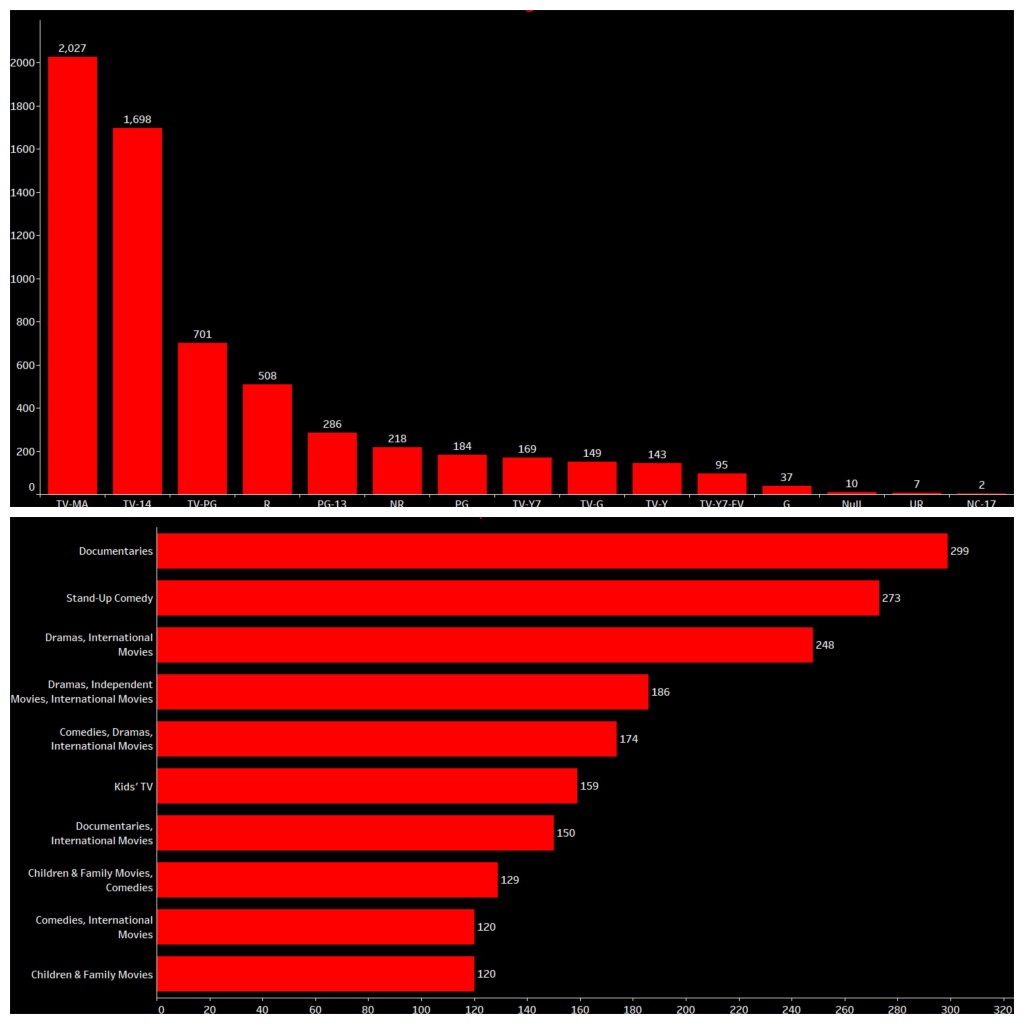
Listed the most popular genres, top directors, and release patterns in major regions.
⚙️ Technologies Used
- Python
- Pandas
- Matplotlib
- Seaborn
- Plotly
- Tableau
📈 Outcome & Learnings
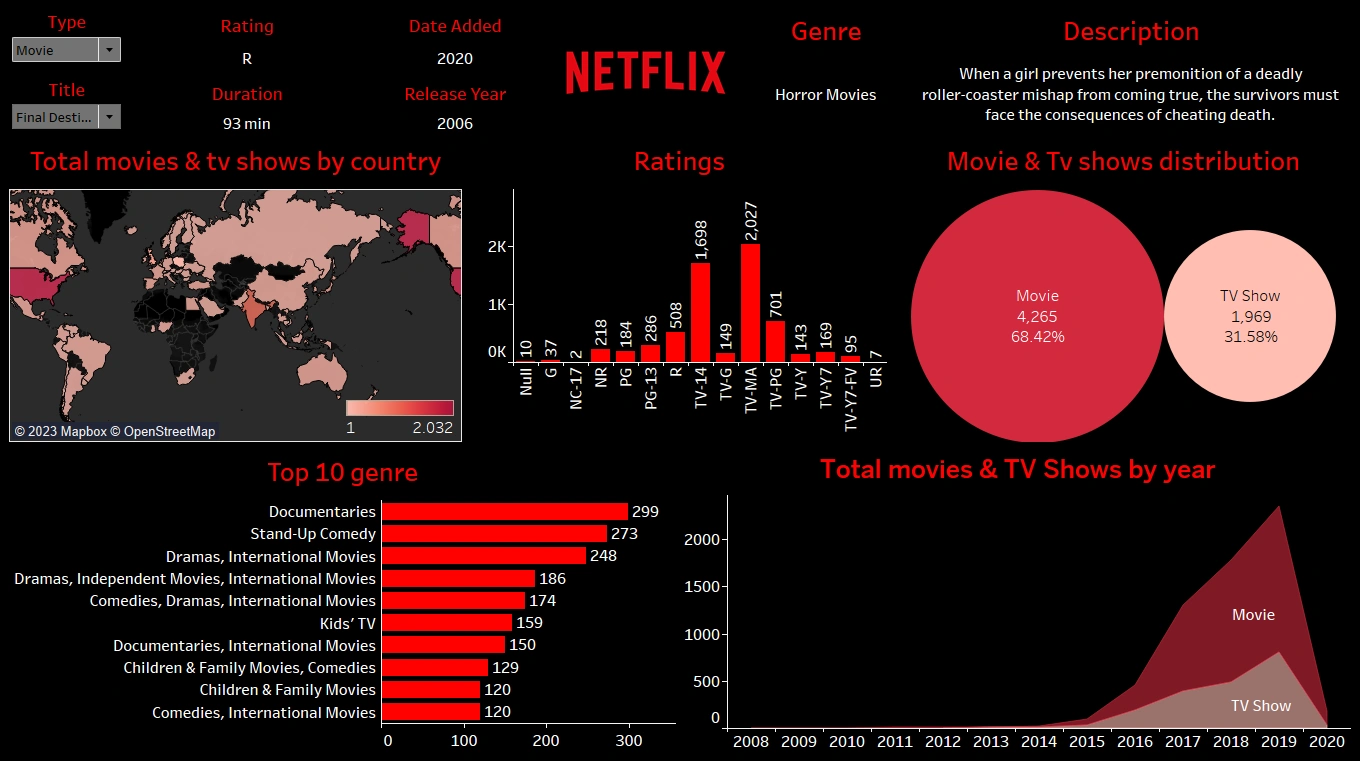
The final dashboard we created in Tableau allowed users to interact with the data easily.
Decision-makers could explore which genres performed best, how Netflix’s content grew in different countries, and what kind of shows dominated each year.
This project showed the power of data visualization and how Exploratory Data Analysis (EDA) can uncover deep insights in simple ways.
It also proved how well tools like Python and Tableau can work together to support data-driven business strategies.
Datraxa — Helping businesses understand trends through data.
🚀 Outcome and Learnings
The final dashboard we created in Tableau allowed users to interact with the data easily.
Decision-makers could explore which genres performed best, how Netflix’s content grew in different countries, and what kind of shows dominated each year.
This project showed the power of data visualization and how Exploratory Data Analysis (EDA) can uncover deep insights in simple ways.
It also proved how well tools like Python and Tableau can work together to support data-driven business strategies.